Building a connected digital growth engine for a Pacific Northwest destination

Gaming, Hospitality

Case Studies
+270%
Paid Search Clicks, YoY
Gaming, Hospitality
+75%
Ecommerce Orders
+10%
Net Sales
3.91x
Meta ROAS
E-Commerce, Fashion
7.2x
Booked revenue, over seven years
+85%
Inbound inquiries, over three years
Entertainment
8.0X
Return on Ad Spend
$591K
Attributed Revenue
741
Conversions
Hospitality
+20%
Social Follower Growth
30%
Email Open Rate
8%
Campaign CTR
Consumer
1,199
Google Ads conversions in one year
$47.44
Cost per conversion, best quarter
Sports & Rec
+74%
Tracked conversions after implementation
+203%
Phone calls after implementation
Healthcare
-74%
Lower ELC cost per conversion
-44%
Lower King’s Schools cost per conversion
Education, Non-Profit & Community, Senior Living

$3.3M
Closed net revenue from paid search, partnership to date
$1.51M
Closed net revenue from organic search & AI referrals, partnership to date
Hospitality
3x
Blended ROAS
35.8%
Session-to-Purchase Increase
Entertainment, Hospitality
$1.8M
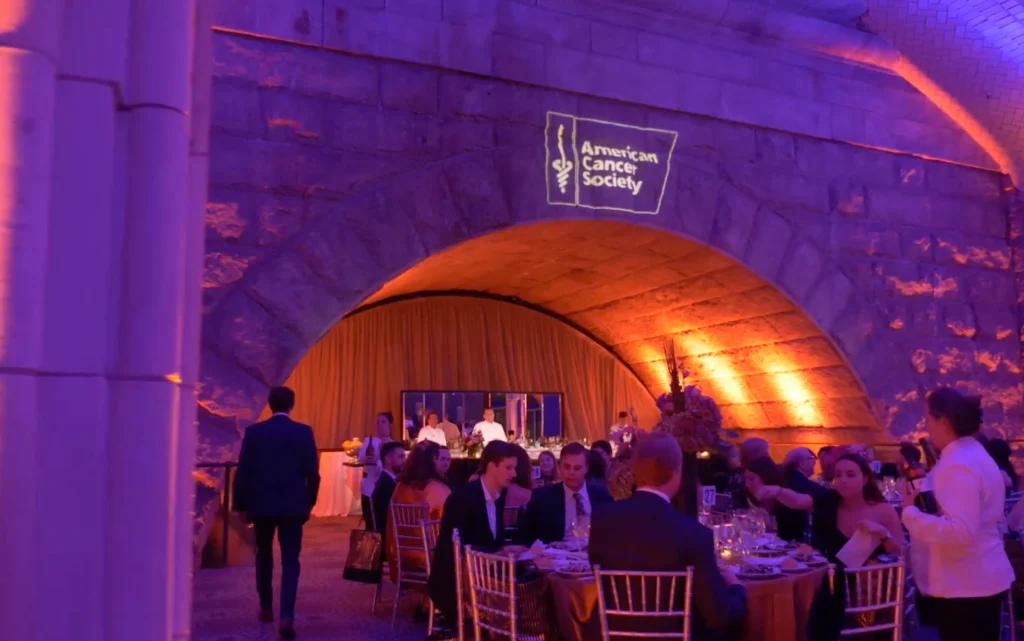
Raised at the New York Hope Lodge fundraising celebration
Non-Profit & Community
4x
Reported return on ad spend
10,000
Email sign-ups
Fashion
+112%
Recorded conversions, 116 days vs preceding
+21.4%
Calculated conversion-to-click rate, matched periods
Hospitality
+268.8%
Total social engagements, YoY
+883.9%
Net new Instagram followers, YoY
B2B & Industrial, Home & Building
30M
Campaign impressions across print, digital and social
Consumer
+114%
Social follower growth, year over year
Consumer
+63%
Google Ads Conversions
Hospitality
29.9%
Paid search conversion rate
$7.07
Cost per tracked action
Financial Services
+25%
Reported sales growth
+15%
Onsite conversion rate
Consumer
100%
Independent living occupancy maintained
$78K
Grant-funded advertising utilized, program lifetime
Senior Living
+30%
Total inbound calls, first four weeks vs preceding
−16%
Paid search spend, first four weeks vs preceding
Home & Building
+63%
Google Ads conversions
−20%
Cost per lead
Health & Fitness, Sports & Rec
+119%
Online vehicle shopping activity, 6-month YoY
+2%
Total vehicle sales, YoY
Automotive
2.5x
Tracked return on social ad spend
−42%
Social cost per tracked purchase
E-Commerce
$2.5M
E-commerce sales, single record season
8+
Years running the sale’s marketing
Fashion
3.40%
Annualized net membership growth
+27%
Estimated branded-search demand, month over month
Financial Services
−92%
Reported cost per lead, first twelve months
+300%
Google Ads conversions, YoY in second twelve-month period
Home & Building
$1M
In sales, first year
E-Commerce, Sports & Rec
50+
Years in business
B2B & Industrial, Public Safety & Industrial Equipment

You will work with the people who set the strategy