SafeRingz
Free demand went away. The orders stayed.
Conversion & Marketing Technology
Creative & Content
Email Marketing
Measurement & Attribution
Media Planning & Buying
Paid Search
Paid Social
2.5x
Tracked Return on Social Ad Spend
−42%
Social Cost Per Tracked Purchase
1.35%
Paid Search Click-Through Rate, Highest of the Relationship
−19%
Non-Brand Paid Search Cost Per Tracked Purchase
25.9%
Returning Customer Rate Across the Store

Free demand went away. The orders stayed.
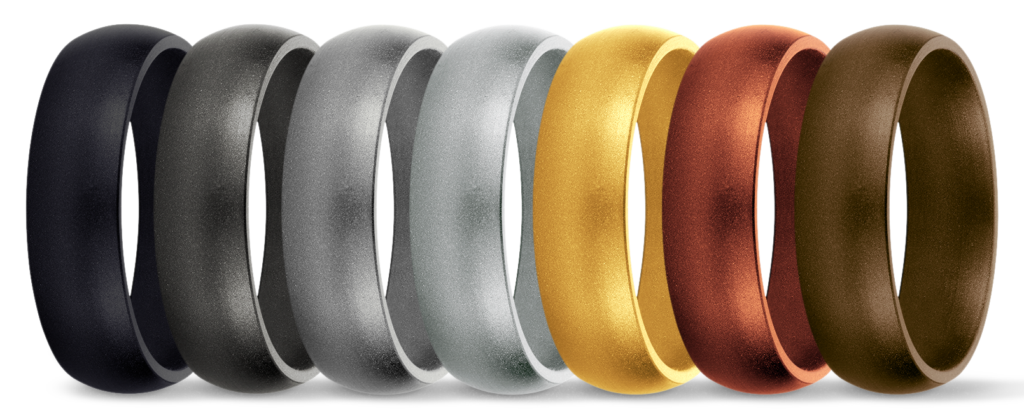
SafeRingz sells silicone rings for people whose work makes metal ones dangerous. SnuggleMud has managed its search, shopping, social and email program through a collapse in the free traffic that once carried the store. Rebuilding the program around the margin in each order held purchase volume while reducing media spend substantially.
Challenge
SafeRingz sells a lower-priced ring to people who need it for their work. That leaves limited space between what an order earns and what it costs to win, with no room for spending that only looks busy. Then the free demand carrying the store began to fade. Search visits were cut in half and organic social nearly disappeared, leaving paid media to cover the gap without spending beyond the point where a sale stops paying.
Approach
SnuggleMud owns the strategy, allocation and measurement across search, shopping, social and email. The program was rebuilt from the unit economics up, so the contribution margin on one order sets the minimum return each campaign must clear. Brand, non-brand, shopping and competitor demand are measured separately rather than blended into one average. A social campaign optimized for clicks instead of buyers was retired, with budget moved behind purchase objectives.
Outcome
Social spend fell by more than 40% while tracked purchases held steady, bringing cost per purchase down by a similar share and moving social from below a 1.0x return to 2.5x. Paid search maintained its cost per order while click-through rate reached its highest point of the relationship on fewer impressions purchased. Because store revenue reflects demand across channels and factors outside media, the claims here stay within what the platforms and client reporting can verify.
−42%
Social Cost Per Tracked Purchase
1.35%
Paid Search Click-Through Rate, Highest of Relationship
25.9%
Returning Customer Rate Across the Store
−19%
Non-Brand Paid Search Cost Per Tracked Purchase
2.5x
Tracked Return on Social Ad Spend
1.3M
Paid Search & Shopping Media Managed
The Work
$1.3M
Paid Search & Shopping Media Managed
88,585
Store Orders, Same Reporting Window
863K
Clicks, Program Lifetime
Unit Economics Foundation
The program was rebuilt from the unit economics up, so the contribution margin on one order sets the minimum return each campaign must clear.
Blended tracked return across search and social increased from 1.18x to 1.32x on 8% less spend.
Channel-Level Measurement
Brand, non-brand, shopping and competitor demand are measured separately rather than blended into one average.
That separation dropped competitor prospecting cost per purchase by 11%.
Shopping and Retargeting
Shopping campaigns were held to the same margin-based standard as every other channel in the program.
Shopping retargeting return increased from 1.10x to 1.20x.
Paid Search Program
Paid search clicks increased 6% on 9% fewer impressions purchased, part of 70.5M impressions and 863,000 clicks across the program’s lifetime.
Click-through rate reached its highest point of the relationship while cost per order held steady.
Social Campaign Retirement
A social campaign optimized for clicks instead of buyers was retired, with budget moved behind purchase objectives.
That shift sits within three managed channels plus lifecycle email, all measured against the same purchase-based standard.